
The Reports feature allows users to run Administration reports.
To view Reports, click Reports from the Administration drop-down menu. To run a report for multiple TPIDs and/or NPIs:
Use the arrow keys to select available Trading Partners. Once selected, the available NPIs for the selected TPID display in the Available NPIs section. Use the arrows to select the desired NPI(s). One or more TPID/NPI(s) may be selected for the report. If no selection is made, the report runs for the TPID selected at login. The TPID selection section is only enabled for sites with more than one TPID/NPI.
Select the report to produce. Once a report is selected, an option field displays requiring the user to enter a date range or select a filter option. This option varies by report type selected.
Select a document format type. If Web Page (HTML) is selected, the report displays at the bottom of the screen.
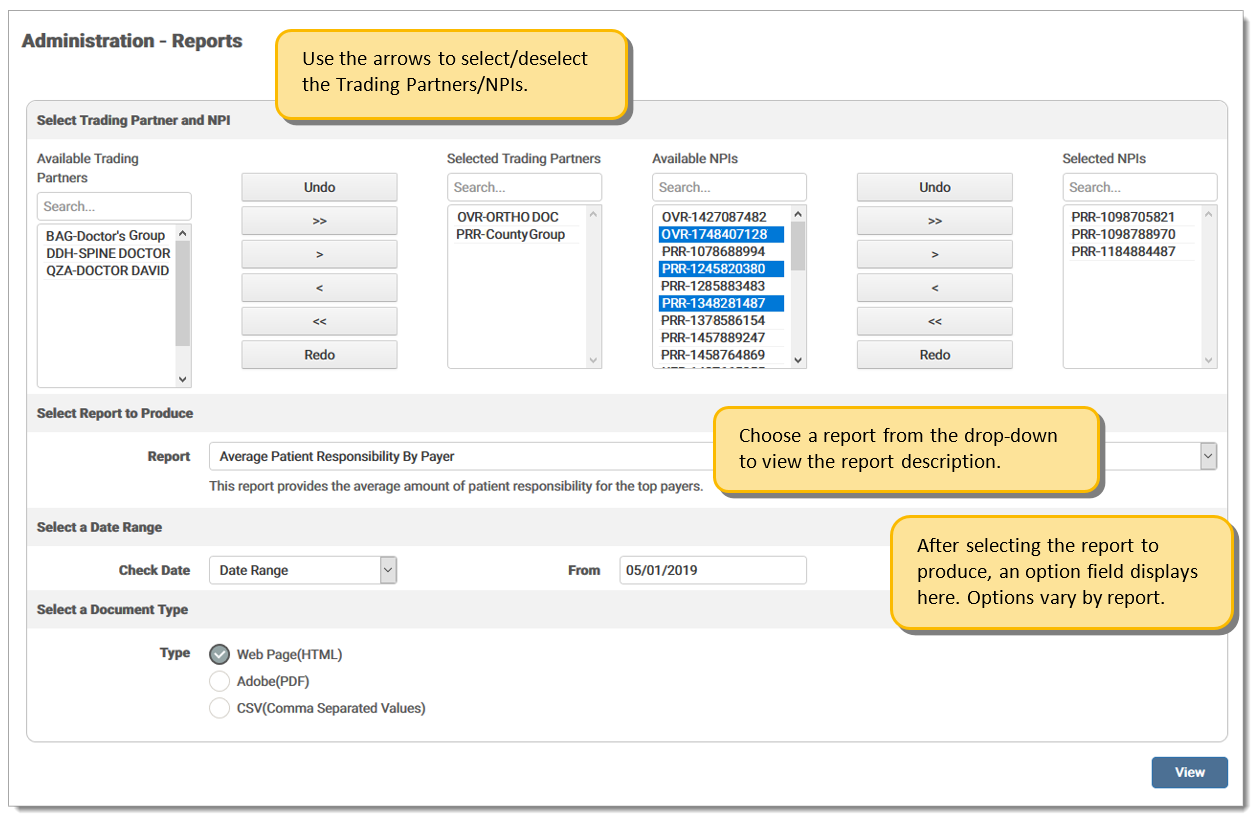
Navigation Arrows:
|
Icon |
Description |
| Undo the last action taken. | |
| Moves all Available TPID/NPIs to the Selected field. | |
| Moves one (1) TPID/NPI to the Selected field at a time. | |
| Moves one (1) TPID/NPI to the Available field at a time. | |
| Moves all Selected TPID/NPIs to the Available field. | |
| Redo the last action taken. |
Report type choices are defined as:
|
Report Name |
Description |
| Average Reimbursement Amount by Payer | This report provides the differences in average reimbursements for payers. Allows the user to view any payment or contracting issues. Options include: Last Full Quarter, Quarter to Date, Last Full Month, and Date Range. |
| Average Patient Responsibility by Payer | This report provides the average amount of patient responsibility for the top payers. Options include: Last Full Quarter, Quarter to Date, Last Full Month, and Date Range. |
| Billed vs. Paid Amounts |
This report provides the differences over time between what is billed and what was paid. Significant changes can alert the user to increased denials or delayed billing. Users can run the report for Month, Week, or Day. Options include:
|
| Claim File Reconciliation | This report displays each file received by eMEDIX for the dates selected. The date range is for the submission date and if the file failed, the details of the failure display on the report. Document type is CSV only. Options include: Last Full Quarter, Quarter to Date, Last Full Month, and Date Range. |
|
Claims Output Trend |
This report returns the total number of claims submitted per month for each trading partner. The report monitors for changes in the number of billed claims and will display slow-downs in office productivity. Options include: Last Full Year, Last Full Quarter, and Quarter/Year. |
| Claim Status | This report provides current claim statuses grouped by Payer or Submission Date, depending on the option selected from the drop-down menu. Options include: Last Full Quarter, Quarter to Date, Last Full Month, and Date Range. |
| Clean Claims | This report provides the clean claim rate for the date range chosen. The pie chart displays the total number of claims submitted, how many were errored out by eMEDIX (in yellow), how many were rejected at the payer (in red), and how many made it straight through to the payer (in green). The percentage of first pass claims is also shown. Options include: Claim Type - Institutional or Professional; Process Date - Last Full Month or Month/Year. Note: Search results may take a long time to display. |
| Days to Payment Average | This report provides the average time to payment by payers for the date range chosen. Some payers do not send all the information back on an 835. In that case, the column will display Not Available. Options include: Last Full Quarter, Quarter to Date, Last Full Month, and Date Range. |
| ERA Analysis | This report shows a summary of ERAs being received against claims submitted and possible ERA enrollment opportunities. Options include: Last Full Quarter, Quarter to Date, Last Full Month, and Date Range. |
| ERA Payment Analysis |
This report provides the breakdown of the payments on the ERA. The payments and adjustments are displayed in the pie chart. The sub-report displays the total claim charges, as well as payer reductions. Options include: Last Full Quarter, Quarter to Date, Last Full Month, and Date Range. Note: This report returns the data as given by the payer on the 835. Due to discrepancies in the information returned by the payer(s), the totals may not balance. |
| Line Reimbursement Rate | This report displays a pie chart indicating the denials at line level to allow the user to have an overall picture of the reimbursement rate at line level. Options are: Lines Paid and Lines Denied. Options include: Last Full Quarter, Quarter to Date, Last Full Month, and Date Range |
| Payer Variance | This report displays the difference between what is charged and what is paid and how that varies from payer to payer. It allows the user to view when payment is incorrect. Options include: Last Full Quarter, Quarter to Date, Last Full Month, and Date Range. |
| Procedure Code Payment vs. Charges | This report displays the difference between charged amounts and paid amounts for the top 25 procedure codes. This allows the user to verify payments for each procedure code. Options include: Last Full Quarter, Quarter to Date, Last Full Month, and Date Range. |
| Professional Rendering NPI Billed Amount Summary | This report displays the amount of charges billed by each Rendering NPI to enable the user to track productivity by Rendering NPI. Options include: Yesterday, Last Full Week, Last Full Month, Last Full Quarter, or Date Range. |
|
Rejected Claims |
Allows the user to view a list of all rejected claims for a selected date range in order to easily make corrections. Users may filter by Claim Type. Options include: Last Full Month, Last Full Quarter, and Date Range. |
| Secondary Claims | This report displays which claims have other payers, which allows the user to verify that the secondary claim has been sent. |
| Top 10 Payer Denial Rate | This report displays the number of denied claims, the total denied dollars, and the denial rate (percentage) for each of the top 10 payers. Options include: Last Full Month, Last Full Quarter, and Date Range. |
|
Top 10 Rejects |
This report displays rejects in order of frequency. This allows the user to identify the root cause of the most common rejects and make corrections as needed. Users may filter by Claim Type and Payer. Options include: Today, Yesterday, Last Full Week, Last Full Month, or Date Range. |
| Top Denied Procedures by Payer | This report provides the top 5 denied procedure codes from the top 10 payers. It also provides the overall top 3 procedure codes denied, and the number of times that a procedure code appears denied and the total dollars denied. This allows the user to track which procedure codes are being denied the most to help reduce denials. Options include: Last Full Month, Last Full Quarter, and Date Range. |
| Top Payers Analysis | This report displays a pie charge indicating the top 3, 5, or 10 payers. This allows the user to view which payers hold the largest risk for the practice. Users select the desired number of payers for the specified date. Options include: Last Full Quarter, Quarter to Date, Last Full Month, and Date Range. |
| Unresolved Rejects | This report displays Unresolved Rejects, which shows those claims that were rejected but never resubmitted. The system checks claims that have a reject status, either from eMEDIX or the payer, and no new claim create. Claims older than 180 days are not included. |
eMEDIX Online | ©copyright 2022 CompuGroup Medical, Inc. All rights reserved.